
Lean Six Sigma – Reality or a Myth?

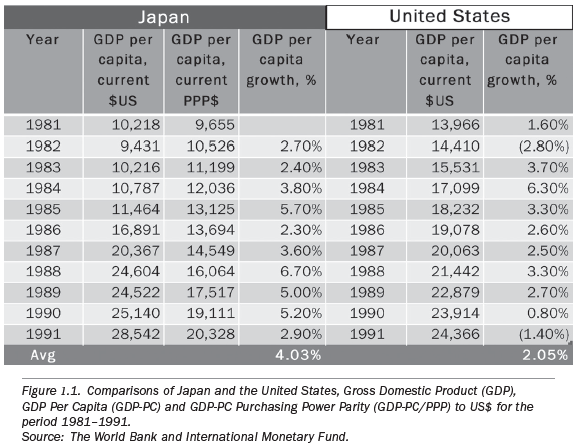 Then, if we look at 1992–2015 (figure 1.2), the average growth of GDP per capita in Japan was only 0.75 percent (less than 20 percent of its previous growth rate), versus an average GDP per capita growth rate of 1.60 percent in the United States. Over this second period, which lasted twenty-three years (so far), the average GDP per capita growth rate in the United States was more than twice Japan’s. This period of time in Japan is commonly referred to as the lost decade—a period of severe economic malaise and underperformance as compared to peer economies, which has turned into two decades and is now going on three decades.
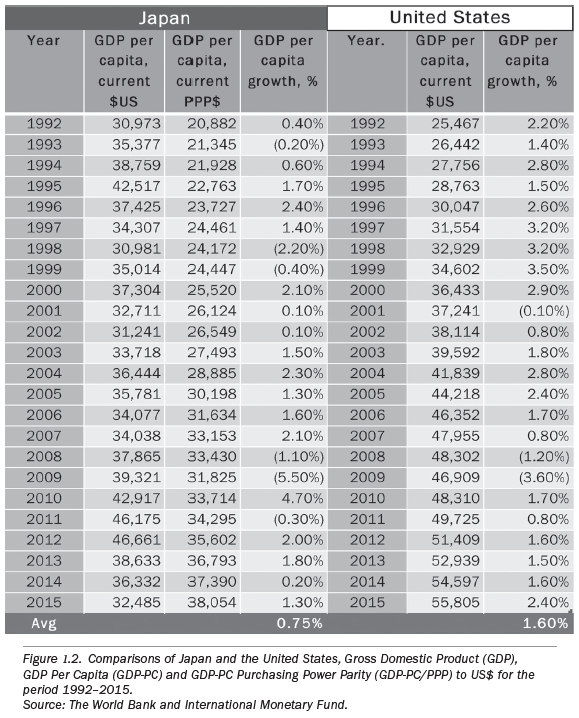 One would think, if Japanese companies outperformed companies in the United States as some would have you believe, the Japanese economy would also outperform the United States. But as these charts demonstrate, I do not believe it can be reasonably argued that Japan, and the industrial might of Japan by proxy, has outperformed the United States for some considerable amount of time. And, according to the International Monetary Fund forecasts, there is no indication of this trend changing anytime soon.Peer Group: Comparing Japanese and American CompaniesWe must also keep in mind that the performance of an entire country may not represent the performance of companies within that country. So let’s drill down a bit further and examine the performance of companies over similar periods.I realize there are many ways of looking at the health of a company, and, as I mentioned earlier, free cash flow from operations is certainly among those with more weight. But I believe the simplest, and arguably most accurate, way of comparing company performance is the value of their shares.After all, share price is a forward-looking indicator. It is an arm’s length reflection of how much value an investor perceives a company has. In evaluating the value, a shareholder will take into consideration all of the more objective financial aspects of the company including free cash flow from operations, the common financial ratios used by analysts, return on capital, price earnings ratios as compared to industry peers, and so on. A shareholder will also factor into the value of a share innovation, quality, customer satisfaction, integrity, sustainability, politics, and other more subjective considerations. And lastly but most importantly, a shareholder will consider the short- and long-term vision of the future for the company as communicated by the leadership, including the growth potential of the company (in both revenue and profits per share) and the faith of the shareholder in the leadership team of the company to pursue and achieve the company’s strategies as communicated. Indeed, the share price of a company over a period of time might not be the only indicator of company performance, but it is the weighted aggregate of all of the others. And this makes it the best indicator.As such, an aggregate of values from a cross section of major companies within a country can be found in the major stock market indices of that country.As with the previous comparisons made using GDP, we will compare the main stock market indices of the United States (DJIA) and Japan (Nikkei) as graphically represented in figure 1.3.The Dow Jones Industrial Average (DJIA) vs the Nikkei AverageThrough 1982, the DJIA and the Nikkei tracked very close to one another, respective to each of their currencies, and growth was rather unremarkable, if there was any appreciable growth in the value of these indices at all. But in 1983, the rate in the increase in the value of the Nikkei versus the DJIA went almost vertical.The NikkeiFrom a value of approximately ¥7,500 in 1982, to a high of almost ¥40,000 on the eve of 1990, it was a heck of a run and fun while it lasted—an increase of over 500 percent in a span of nine years. The pace was relentless, with just a brief pause for the stock market crash of 1987. During this same period, the DJIA enjoyed an increase in value of approximately 100 percent, which is considered a very reasonable rate of return in its own right.However, this dramatic acceleration in the increase of the value of the Nikkei had all of the obvious indications of being possessed by irrational exuberance.3 The funny thing about financial bubbles is that people don’t normally realize they are in one until it pops.It was all downhill from there.The fall from grace was swift and ruthless. Breaking through the ¥20,000 mark in 1992 on its way to ¥17,500 by late 1993, the Nikkei had lost almost 60 percent of its value.The slope of the decline in the value of Japanese companies that comprise the Nikkei from 1990 through 1992 started by following the classic V shape4 normally associated with a market under strain and represented by the expected sharp downstroke, as we see in the graph. But the Nikkei never experienced a recovery that produced a sharp upstroke in the graph to complete the classic V, as would be expected. Unlike the recessions endured by the United Stated and its free-market peers, there was never any recovery in the aggregate of companies that comprise the Nikkei.Instead, over the next few years, the Nikkei experienced a few dead-cat bounces: The index would rally to around ¥20,000 before falling back again. Then in 2000, the Nikkei began another dramatic slide in value, until it broke through ¥10,000 in 2001.From then, there was a run-up in value until 2007 (along with its other G-75 peers), when the Nikkei closed in on ¥20,000 before falling back during the global financial crisis of 2007/2008. And from 2013, with the introduction of “Abenomics,”6 the Nikkei made another run and reached ¥20,000 in 2015 before again sliding in 2016.Certainly, these momentary recoveries in company value after the crash of the Nikkei from 1990–1992 were influenced by the macroeconomic economic stimulus policies of the Japanese government and coordinated with the Bank of Japan. But for all intents and purposes, the Nikkei—and the value of the companies that comprise the Nikkei—have been in a coma since 1992.The DJIAFrom 1982 to 1992 in the United States, we can clearly see that the growth in value of the companies of the DJIA (see figure 3.3 below) was steady, but rather unremarkable, especially when compared to the dramatic increase in value of those companies who comprise the Nikkei.But in 1992, we can see the start of an accelerated and sustained upward trend where the value of the DJIA increased from approximately $2,500 to approximately $18,500 in 2016, an increase of over 700 percent—but over a twenty-four year period. The time period is important because it indicates a pace of growth that has been sustained over a considerable period of time.The two dips in the DJIA represent the recession of 2001 and the financial crisis of 2008. But on both occasions, the markets endured a sharp downstroke in valuation followed by a sharp upstroke: a classic V. The pain was felt, but recovery came quickly.As is glaringly apparent in the graph, whereas the downstrokes endured by the Nikkei were as dramatic as in the DJIA, the upstrokes in the DJIA from 2000 onward were quicker and more dramatic than in the Nikkei. This resulted in step improvements in the value of the DJIA over the upstrokes in the Nikkei.
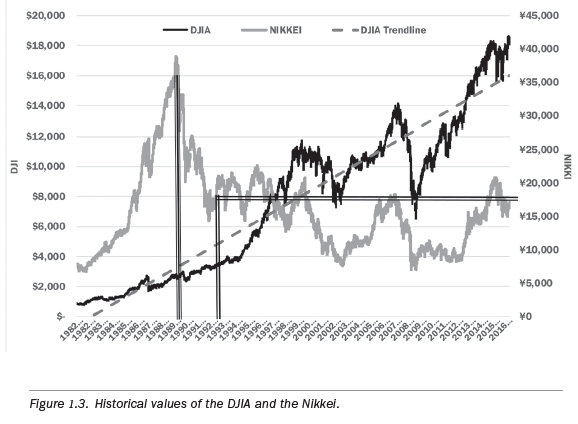
The bottom line is, at ¥20,000, the value of the companies of the Nikkei in mid-1992 is greater than the value today—twenty-four years later. And during almost all of that time, the value of the Nikkei was considerably less than ¥20,000. In fact, for a third of that time (seven years), at ¥10,000, the Nikkei was half the value it was during any of its run-ups between 1992 and 2016. Picture those numbers, sustained for as long as they have been (and still no end in sight) in any other developed, G-20 country. It’s seems remarkable.
And can you imagine the following speech from a CEO of an American company at an annual shareholders meeting? I can’t.
“My fellow shareholders, I stand before you today to let you know your investment in our company is safe. And I guarantee your investment will be worth the same twenty-four years from now as it is worth today.”
I certainly couldn’t imagine the CEO of a company in the United States still being the CEO for too long after that speech. He or she would probably be fired before the sound of their voice faded from the room.
And I find it impossible to imagine how leaders in business might hold Japanese companies, and their leadership and approaches to management, in such high esteem when the results and numbers don’t support it.
The Yen
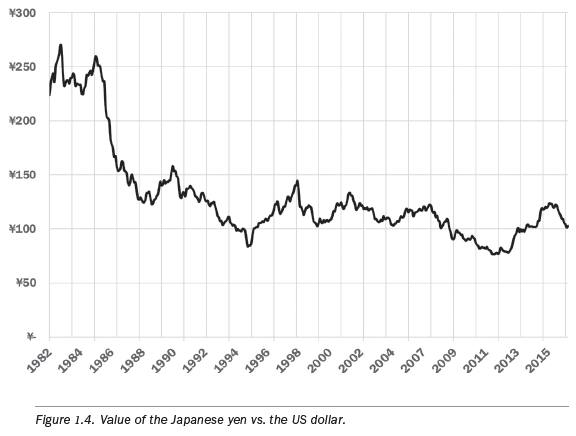
Something else important to consider is the value of the Japanese Yen versus the US Dollar (see figure 1.4 below) and how these two variables (value of the yen versus the dollar and the value of the companies on the Nikkei) interplay with one another.
The value of the yen held reasonably steady against the dollar from 1982 to 1986, at approximately ¥240 to $1.00. But in 1986, the value of the yen abruptly rose against the dollar—a period that also coincides with the flip in the relative values of Per Capita GDP and Per Capita GDP adjusted for Purchase Price Parity as seen in figure 3.1—until it reached ¥140 to $1.00 in 1992 before continuing its rise to ¥80 to $1.00 in 1995.
Therefore, much of the run-up of the value of the companies of the Nikkei until 1985–1988 was not due to some prowess in company performance but, actually, a reflection of the amplification effect of an increase in the value of the yen from ¥250 to $1.00 to ¥175 to $1.00. Remember, the Nikkei is valued in yen, so the values of the companies didn’t change as much as it was that the value of the yen that changed.
 The CultureIn addition to the economic arguments of Japan and Japanese companies having superior performance to their Western peers, there is this notion that the culture of Japanese companies is more collegiate, open, and encourages engagement. However, a report from Ernst and Young showed that full-time workers in Japan—whether employer, employee, or colleague—had the least amount of trust in the coworkers within their companies than any other country polled. In fact, of the Japanese workers polled, only an average of 21 percent expressed trust in the people in their companies. Compare this with 45 percent in the United States and 48 percent globally.The lack of trust expressed by the Japanese was a negative outlier among all the countries polled by a minimum factor of more than 50 percent. And it certainly runs contraire to the expectations we would have after reading about the Japanese methods of management, with its emphasis on employee engagement, camaraderie, collaboration, and team building. What statement is this poll making with regards to the reality of the Japanese style of management?There are four main takeaways:
- The run-up of the Nikkei from all causes was relatively irrational and short-lived (eight years, 1982–1990), and the bursting of the bubble was equally swift.
- The perceived run-up in value of the companies of the Nikkei was amplified as a result of the dramatic increase in the value of the yen to the dollar.
- The value of the companies of the Nikkei is less today than it was twenty-four years ago. These are not companies in which I would want to invest or emulate.
- The corporate culture in Japanese companies is not nearly as collegiate as some would have you believe. There are no choruses of “Kumbaya” being sung.
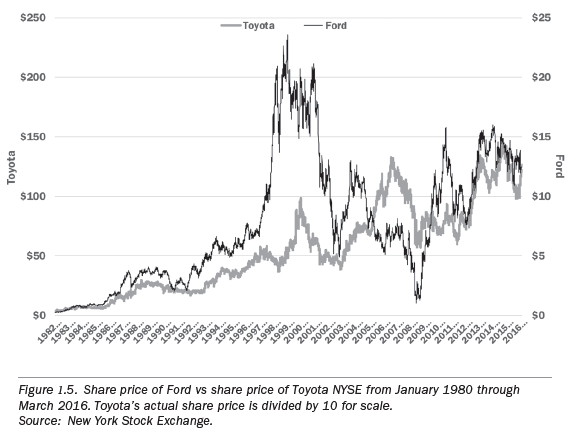 We can see, from 1982 to 1992, the value of a share in Toyota tracked very closely to Ford. Relative to one another and in US dollars, Toyota did not enjoy the dramatic rise in value that was reflected in the Nikkei, nor did it suffer the dramatic drop in value.In 1992, however, the value of a share of Ford started to increase at an accelerated rate as compared to Toyota and this pace quickened yet again in 1997. Ford enjoyed a value premium of 200 percent to 350 percent over Toyota for a period of four years, until the recession of 2001 brought the relative value of the two companies back closer to parity. Still, it wouldn’t be until 2005 when the relative value of a share of Toyota would exceed the value of a share of Ford. And the relative values of the two companies since have tracked closely with one another, exchanging turns at the top spot several times.Can we say from this chart that Toyota was a better-managed company than Ford—a better-performing company than Ford—over the last thirty-four years? I don’t see it, and the data doesn’t support it.Share-Value Aside, What about Execution?Toyota has produced a total of ten million vehicles per year (including automobiles and trucks across all brands), plus or minus 5 percent, in every year between 2012 and 2015. But regardless, these have been very difficult years for Toyota and should challenge the claims to the effectiveness of the TPS to its core.Information obtained from the Toyota website and the National Transportation Safety Board (NTSB) indicates, in each of the years from 2012 through 2015, Toyota recalled a minimum of 5.3 million vehicles, hitting a record recall of 8.4 million vehicles in 2015.In 2012, Toyota had 12 recalls effecting 5,300,000 vehicles.In 2013, Toyota had 15 recalls effecting 5,300,000 vehicles.In 2014, Toyota had 24 recalls effecting 6,000,000 vehicles.In 2015, Toyota had 27 recalls effecting 8,400,000 vehicles.And 2016, at over 4,000,000 vehicle recalls (thus far), has not been much better.This is a minimum recall rate of over 50 percent of annual production—and this does not include the unknown number of vehicles involved in “service bulletins,” which are problems known to the company that require remedial action but do not warrant a formal recall. Here are some of the recall details:
- In 2012, Toyota issued a recall for 7.4 million vehicles due to a problem with the power window mechanism posing a fire hazard.
- On October 17, 2013, 803,000 vehicles were recalled because water from the air conditioning condenser unit housing could leak onto the airbag control module and cause a short circuit.
- On August 7, 2013, 342,000 vehicles were recalled because screws that attach the seat belt pretensioner to the seat belt retractor within the seat belt assembly for the driver and front passenger could become loose over time due to repeatedly and forcefully closing the access door.
- In 2014, just one of the many recalls Toyota issued that year was for problems involving air bag cables and rail seats, which affected 6.4 million vehicles.
- In 2015, a recall issued to fix power window switches affected 6.5 million vehicles, and another recall involving defective air bags affected 1.4 million vehicles.
- And in 2016, a few of the more significant recalls issued included 1.1 million vehicles with defective lap-belts, and another 337,000 vehicles were recalled because of defective rear suspension arms.
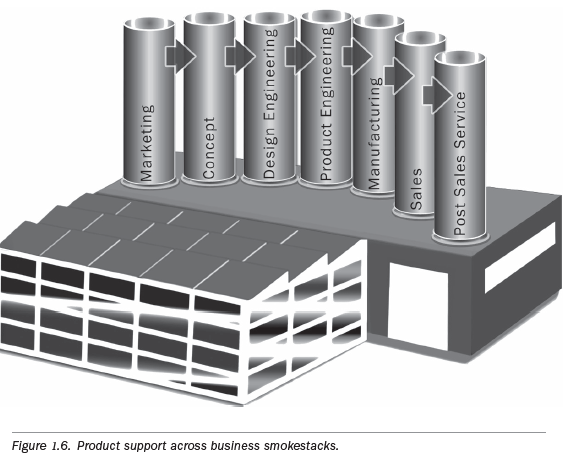 A basic tenant of the TPS and Lean is to rally resources when an opportunity for improvement is discovered, so it stands to reason that a defect discovered at any point along this production line should result in an alert and the dispatch of a kaizen team to resolve the defect before resuming production.Certainly, the TPS and Lean Six Sigma have played a significant role in bringing companies to a higher level of performance over the past several decades, and those early adopters certainly realized rewards.But today, most companies have recognized the benefits of these methodologies and have incorporated them as a cornerstone of their own continuous improvement programs, even if to varying degrees of completeness and success, including at Toyota. And, if everyone is doing it, it’s no longer a differentiator, and it no longer drives a competitive advantage.The business that focuses on cutting waste over innovation and driving value to the customer—for which the customer is willing to pay a premium—is not at any particular advantage. Nor is the business that optimizes its processes but does not take the time to balance these processes so that they work harmoniously within the systems they comprise.Instead, businesses that perform the following actions more quickly, efficiently, and effectively than their competitors have the advantage today:
- Are innovative, creating demand and marketplaces
- Thoroughly understand their capacity, capabilities, and weaknesses
- Quickly recognize, anticipate—even seek—an opportunity or threat
- Rapidly formulate an effective response
- Evaluate and make the go/no-go decision
- Decisively deploy a response
- React to the fluidity of engaging

To summarize; the competitive advantage for businesses in the 20th Century was centered around the efforts related to process excellence—eliminating waste and making the processes throughout a business as efficient and as effective as possible. And this was accomplished using a variety of disciplines including (but not limited to) Lean, Six Sigma, Theory of Constraints, and so on.
This is not to say that a mastering of these management systems, methodologies, and their tools are obsolete or otherwise diminished in their importance. They are a necessary foundation on which to build and go beyond.
But, time is the enemy of the 21st Century company.
Therefore, the competitive advantage will go to the companies that can see further beyond the horizon then their competition, be able to recognize opportunities and threats sooner, have the ability to devise and deploy decisive engagements of those opportunities and threats more quickly—and be capable of making adjustments in real-time as circumstances unfold.
Not just see further and detect sooner, but decide and act faster.
This means, they will have to make decisions more quickly and more boldly—often synthesizing a course of action from incomplete data.
And to be successful here, companies will have to improve their capabilities and capacities—not just within the business siloes—but horizontally integrated across the siloes. They will have to work to improve their organizational design so that, as an organization, they are operating efficiently and effectively. Therefore, the competitive advantage will go to the businesses that not only have a command of the fundamental building blocks of process excellence, and systems excellence, but also achieve a level of operational excellence – ensuring the entire organization is in a State of Readiness.
The key to success here are having an organizational design that is built for speed—nimble, capable, and decisive—and investing in talent. Not just hiring and retaining the best, which will be increasingly more difficult as the competition for talent in the talent pool becomes tighter. But investing in those who are already working within your organization so that they can be the best they can be and drive value throughout organizations.
After all, you can’t be a high-performance organization without having high-performance teams who are made-up of high-performance individuals.
By Joseph Paris Paris is the Founder and Chairman of the XONITEK Group of Companies; an international management consultancy firm specializing in all disciplines related to Operational Excellence, the continuous and deliberate improvement of company performance AND the circumstances of those who work there – to pursue “Operational Excellence by Design” and not by coincidence.
He is also the Founder of the Operational Excellence Society, with hundreds of members and several Chapters located around the world, as well as the Owner of the Operational Excellence Group on Linked-In, with over 60,000 members. Connect with him on LinkedIn or find out more here: www.JosephParis.me/card


